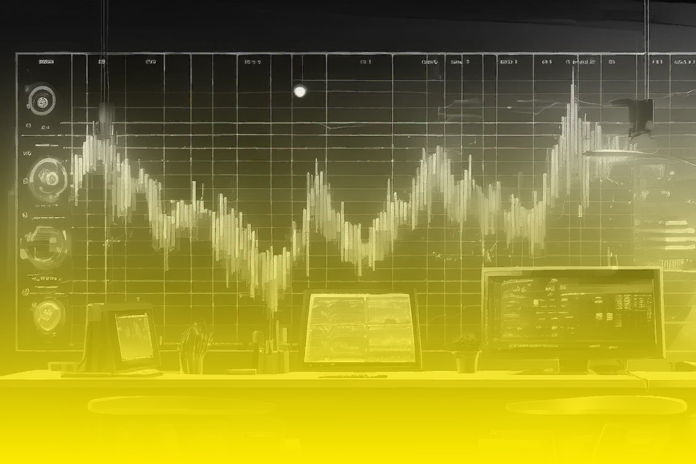
Types of Charts: Line, bar, and candlestick charts.
In Forex trading, different types of charts are used to represent price movements over a specific period. These charts help traders analyze trends, patterns, and market behavior, allowing them to make informed trading decisions. Here’s an overview of the three most common types of charts: line charts, bar charts, and candlestick charts.
Types of Charts
1. Line Charts
Definition: A line chart is the simplest form of chart used in Forex trading. It displays a single line connecting successive closing prices over a specified period.
Features:
- Visual Simplicity: Line charts offer a clear, uncluttered view of the overall trend by focusing solely on the closing prices.
- Basic Trend Analysis: Ideal for getting a quick overview of market direction and identifying trends.
How to Read:
- Single Line: Each point on the line represents the closing price for a specific time frame (e.g., hour, day, week).
- Connection: The line connects these points, providing a continuous representation of price movements.
Pros:
- Easy to understand and use.
- Helps identify support and resistance levels.
Cons:
- Lacks detailed information, such as opening prices, highs, lows, and price volatility.
2. Bar Charts
Definition: A bar chart is more complex than a line chart and provides more information about price movements. It shows the opening, high, low, and closing prices for a specific time frame.
Features:
- OHLC Data: Each bar represents the open, high, low, and close for a given period.
- Vertical Bar: The top of the vertical bar represents the highest price, and the bottom represents the lowest price.
- Horizontal Ticks: The tick on the left side of the bar shows the opening price, while the tick on the right shows the closing price.
How to Read:
- Length of the Bar: Indicates the range of price movement (high minus low).
- Position of Ticks: Reflects whether the price closed higher or lower than it opened.
Pros:
- Provides detailed information about price action.
- Useful for identifying price ranges and volatility.
Cons:
- More complex and can be harder to interpret for beginners.
3. Candlestick Charts
Definition: Candlestick charts are similar to bar charts but provide a more visual representation of price action. They are one of the most popular chart types used in Forex trading.
Features:
- Body and Wicks: Each candlestick consists of a body and wicks (or shadows) that represent the range of price movement.
- Body: The area between the opening and closing prices.
- Wicks/Shadows: Lines extending from the body to the high and low prices of the period.
- Color Coding: Candlesticks are typically color-coded to indicate bullish or bearish sentiment.
- Bullish Candle: Indicates a price increase (usually white or green).
- Bearish Candle: Indicates a price decrease (usually black or red).
How to Read:
- Body Size: A large body indicates strong buying or selling pressure, while a small body indicates indecision.
- Wick Length: Long wicks suggest rejection of higher or lower prices.
Pros:
- Easy to interpret visually.
- Provides comprehensive information about market sentiment.
- Useful for identifying patterns and signals, such as doji, engulfing patterns, and hammer.
Cons:
- Can become cluttered with too many indicators and patterns.
Conclusion
Each chart type serves different purposes and provides unique insights into market behavior.
- Line Charts are best for getting a quick overview of market trends.
- Bar Charts offer detailed price information and are useful for analyzing price ranges and volatility.
- Candlestick Charts are favored for their visual clarity and ability to reveal market sentiment and patterns.
Choosing the right chart type depends on your trading style, preferences, and the specific analysis you wish to conduct. Understanding the strengths and weaknesses of each chart type is essential for making informed trading decisions.


